
This page is an architecture map to keep open, and a companion to the hardware map: that page follows one memory access through the hardware, this one follows one market data message through the threads. It has three parts, in the order “where → how fast → how to split”:
- Architecture map: the boxes a message passes through on its way to a fill, and which post covers each box.
- Times: roughly how long each stage takes, to tell which stage is worth optimising. They are orders of magnitude, not measurements of any one system.
- How to split: how industrial systems split threads, where they put queues, and where they have to join.
When a later post covers a new component, it goes here.
1. Architecture Map: The Boxes a Message Passes Through
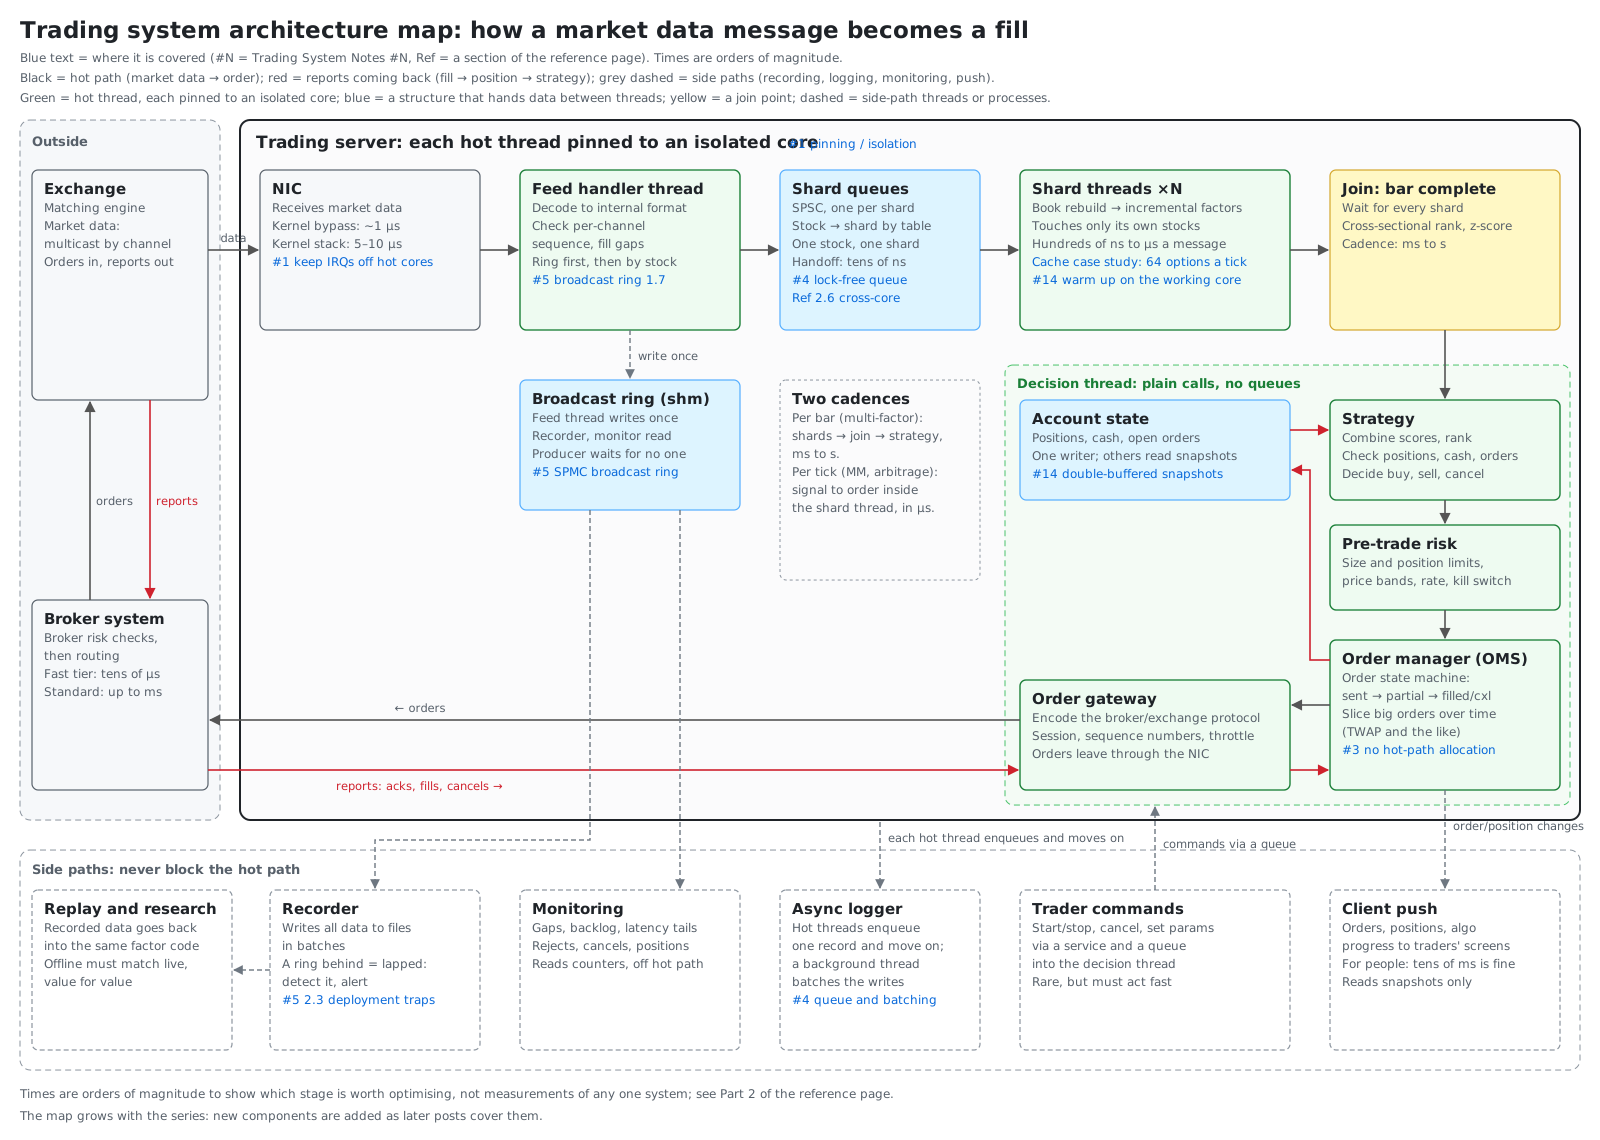
Green boxes are hot threads, each pinned to an isolated core; blue boxes hand data between threads; yellow is a join point; the dashed boxes along the bottom are side paths. Black lines carry market data to an order, red lines carry reports back, and grey dashed lines are side paths. Click the map to open the interactive version: click a box to see what it does and why it is built that way, or pick a path and step through it.
1.1 The Path of a Tick: Market Data → Order
- The exchange multicasts market data by channel, and the NIC receives the packet.
- The feed handler thread decodes it and checks the channel’s sequence number; a gap has to be recovered.
- It first writes the message into the broadcast ring for readers that are not in a hurry, such as the recorder and the monitor, and moves on (#5).
- Then it looks up the stock’s shard and writes into that shard’s queue (#4). A stock always goes to the same shard, so its messages stay in order.
- The shard thread updates the stock’s order book, then its factors, incrementally, touching only its own stocks’ state.
- A cross-sectional strategy waits until every shard has finished the bar, then ranks and scores everything together.
- In the decision thread, the strategy decides what to buy, sell or cancel, pre-trade risk checks it, and the order manager takes over; big orders are sliced and sent over time.
- The order gateway encodes the order and sends it through the broker’s system to the exchange.
1.2 The Path of a Report: Fill → Position → Strategy
- After matching, the exchange sends execution reports: acknowledgements, fills and cancels. They come back through the broker’s system to the order gateway.
- The order manager updates the order’s state: partly filled, filled, cancelled.
- The account state follows: positions, cash, open orders. Only the decision thread writes it.
- The next decision uses the new positions and cash, which closes the loop; the client push sends the changes to the traders’ screens.
1.3 Two Cadences: Per Bar or Per Tick
Per bar (cross-sectional, multi-factor): every stock finishes the bar, then everything is scored together, at a cadence of milliseconds to seconds. A handoff of tens of nanoseconds is invisible here; what matters is how long a wave of data takes to be fully processed.
Per tick (market making, arbitrage): one message can trigger one order. The shard thread computes the signal, runs the risk checks and sends the order itself, with no join and no queue, in microseconds end to end; every extra cross-core handoff adds tens of nanoseconds and some jitter.
1.4 Side Paths: Slow Is Fine, Blocking Is Not
Recording, logging, monitoring and client push are side paths: a hot thread writes one entry into a ring or a queue and moves on, and other threads or processes do the slow work. Side readers may read in batches, but their capacity has to be sized so they never get lapped. Trader commands (start/stop, cancel, change parameters) go the other way, through a service and a queue into the decision thread.
1.5 Index: Which Post Covers Each Box
| Box | Post |
|---|---|
| Pinning hot threads, keeping NIC interrupts off hot cores | #1 CPU Isolation and NUMA |
| Why a cross-core handoff costs tens of nanoseconds, false sharing | #2 Memory Ordering and Cache Lines · MESI · Ref 2.6 |
| No allocation on the hot path (orders, message objects) | #3 Memory Pools and Allocators |
| Shard queues (SPSC), async logging | #4 Lock-Free Queues and Micro-Batching |
| Broadcast ring, lapped recorders, resuming after a restart, when not to use a broadcast ring | #5 An SPMC Broadcast Ring in Shared Memory |
| Several threads’ orders converging on one gateway (multi-producer queues), blocking queues on side paths, whether a full queue blocks or drops | #18 Thread-Safe Queues |
| The computation for one message in a shard thread | A Cache Case Study: Repricing 64 Options per Tick |
| Warming up before the open, double-buffered account snapshots | #14 Prefetching, Cache Warming, and Double Buffering |
| Join, strategy, risk, order manager, order gateway | Part 3 of this page; later posts will add more |
2. Times: Roughly How Long Each Stage Takes
These are orders of magnitude to aid understanding, not measurements of any one system. Rows marked “measured here” come from the linked posts; the rest are typical figures.
| Stage | Roughly | Notes |
|---|---|---|
| Exchange → this machine’s NIC | Co-located: a few µs; through a market data vendor: a few ms | Depends on distance and how many hops |
| NIC → the program has the packet | Kernel bypass: about 1 µs; kernel network stack: about 5–10 µs | The kernel path pays for an interrupt, a copy and a system call |
| Decode one message | About 0.1–1 µs | Depends on the format |
| One cross-core handoff (queue, ring) | About 20–100 ns | One cache line moving between cores (Ref 2.1) |
| One write into the broadcast ring | About 3–40 ns | Measured here: flat out, more readers sitting on the newest slot cost more (#5 1.6) |
| Book and factor update for one message | Hundreds of ns to a few µs | Depends on the factors; one cache level further away costs several times more |
| Join | Waits for the slowest shard | A cross-sectional strategy runs per bar: milliseconds to seconds |
| Strategy and risk | Per-tick decision: microseconds; ranking a few thousand stocks: about 100 µs | All in memory |
| Order to the exchange and report back | Co-located: tens to hundreds of µs round trip; through a standard broker tier: up to ms | Network and matching; little to tune on your side |
| Push to traders’ screens | Tens of ms | For people; enough is enough |
| Disk write | Milliseconds | Which is why it lives on a side path |
The table says two things. First, a handoff of tens of nanoseconds disappears in a chain measured in milliseconds; it is only worth chasing in systems whose whole chain takes a few microseconds. Second, when market data surges, what slows things down is queueing, not handoffs (3.5).
3. How to Split: Rules from Industrial Systems
3.1 Run the Critical Path to Completion on One Thread; Queues Only for Side Paths
The fastest systems receive, decode, update the book, decide and send on a single thread, one function call after another, with the data staying in that core’s cache. Every queue between threads is a cross-core transfer of tens of nanoseconds plus some jitter, so queues are used only to push slow work (recording, logging, monitoring) off the hot thread. One step faster, decoding and even order sending move into an FPGA on the network card, and software only sets parameters.
3.2 Use More Cores by Sharding by Stock, and Run Each Shard to Completion
When one thread cannot keep up with the whole market, split the stocks across threads. A stock’s messages must be processed in order, so each stock always belongs to one thread, and the threads run in parallel. Balance by message volume, not by number of stocks: the busy names send far more messages, so the usual approach is a stock → thread table built from the last few days’ volumes and fixed before the open. Exchanges already publish market data by channel; if you can receive channels directly, there is no need to split again yourself. Only when the source is a single full stream (a vendor feed, say) does the feed thread dispatch by the table.
3.3 One Stream, Several Readers: Broadcast Ring or Separate SPSC Queues
When readers all need the full stream, come and go, or live in other processes (recording, republishing, monitoring), use a broadcast ring: one write, and the producer never looks at the readers. When readers each need a subset, or a drop must be known the moment it happens, use per-reader SPSC queues. The two often combine: the feed thread writes each message into the broadcast ring and also into the queue of the shard that owns the stock (#5 1.7).
3.4 Join Only Where You Must, and Give State a Single Writer
Cross-sectional scoring needs every stock, so it has a join point; a stock’s own factors never wait for anyone. Positions, cash and open orders have a single writer, the decision thread; the push service and the monitor read the snapshots it publishes and never touch the copy being changed. How to publish a snapshot without readers seeing half old, half new data: #14, double buffering.
3.5 Surges: Queueing, Not Handoffs
At the open, at the close and on news, messages arrive several times faster than usual. As soon as each message takes longer to process than the gap before the next one, a backlog builds: later messages wait for earlier ones, and the factors run on stale data. A queue handoff of tens of nanoseconds is negligible next to that; what to save is the queueing, by spreading stocks across more threads or doing less work per message.
The backlog sits in the rings and queues: backlog = (arrival rate − service rate) × duration, and it must stay below capacity; a broadcast ring that overflows laps its readers (#5 2.3.2). To find out whether you have enough, replay the first minutes of a real trading day at the original pace, measure the time from arrival to the end of processing for every message, and watch how the backlog rises and falls.
3.6 Side Paths Must Never Block the Hot Path
A hot thread logs or hands data to the recorder by writing one entry into a queue or ring and moving on (#4); formatting, disk writes and pushes happen on other threads. Readers that are not in a hurry should not spin on the newest slot: reading in batches every so often keeps them from taking the producer’s line on every message (#5 1.6.5).
3.7 Replay Through the Same Code
Feed the recorded data, in its original order, back through the same factor code; only when offline results match live results value for value can the replay be trusted. It is also the regression test after a code change: on the same day of data, not a single output value may change.