
This page is a map to keep open, not a post. It has three parts, in the order “where → how big and how fast → how to combine”:
- Memory hierarchy: the hardware map, which boxes a read or a write passes through, and which post covers each box.
- Performance parameters: latency, bandwidth and capacity for each box, how many requests can be in flight (MLP), and how fast the CPU itself wants data (bandwidth demand). They are rough magnitudes for intuition, not any particular machine.
- Estimation model: one formula that strings the numbers of Part 2 together, to tell whether code is slow because it moves too much or because each move is slow.
When a later post covers a new hardware layer, it goes here. One layer up, the threads a market data message passes through are mapped in Trading System Architecture.
1. Memory Hierarchy: The Boxes One Access Passes Through
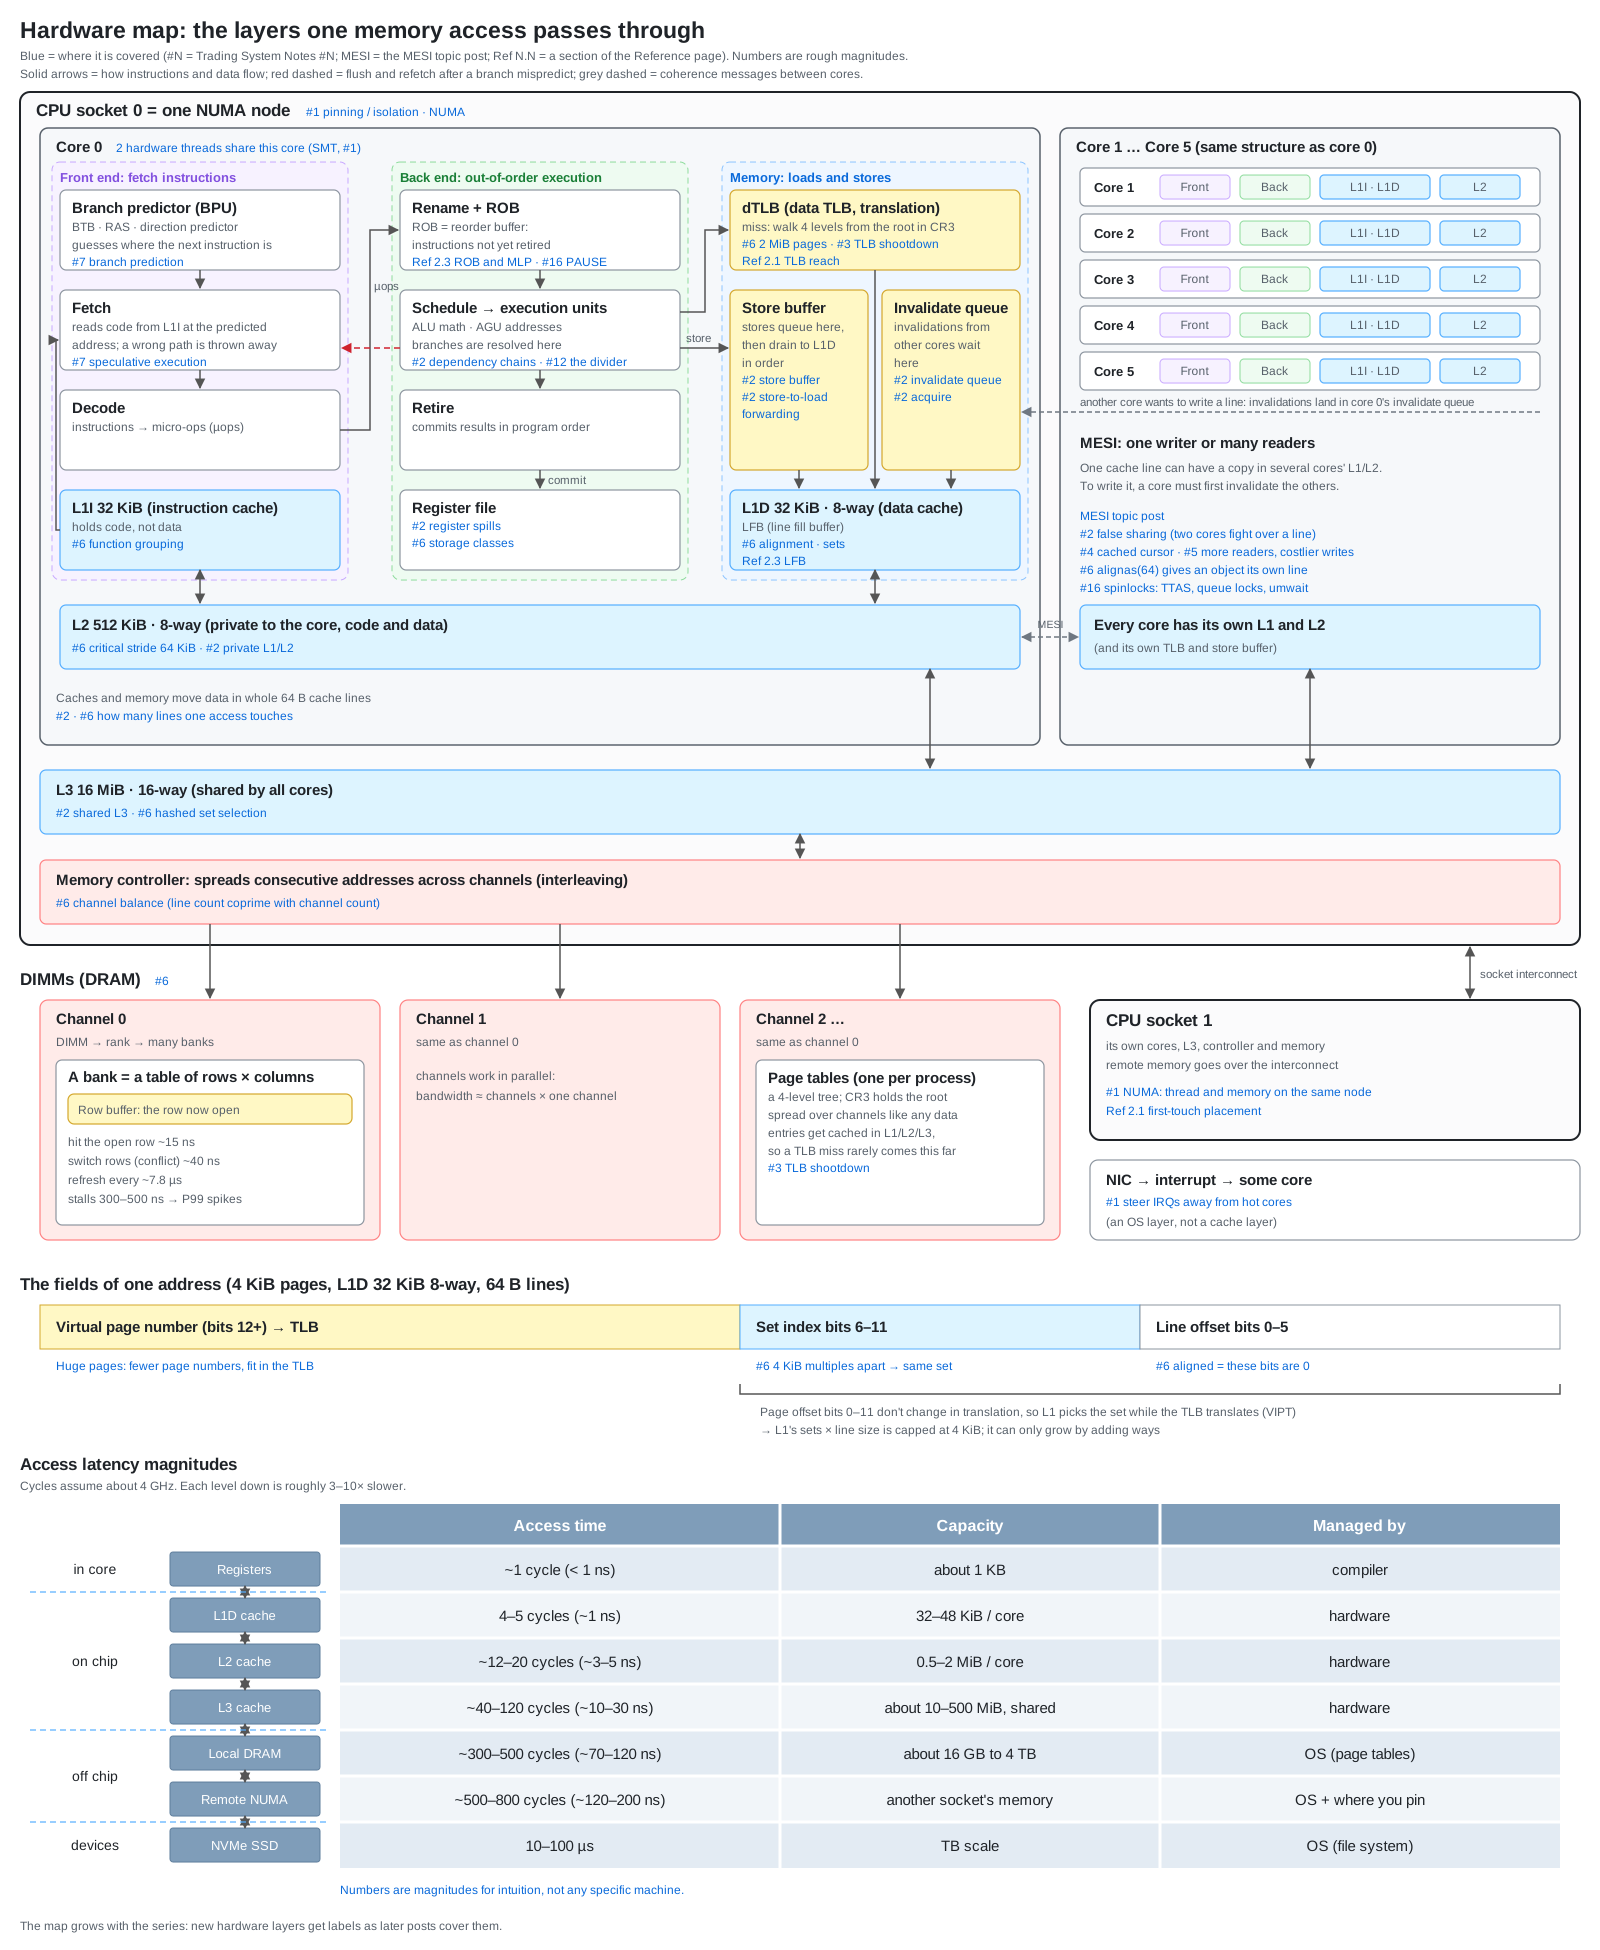
Blue text says where something is covered: #N is Trading System Notes #N, MESI is the topic post, and “Ref N.N” is a section of this page. Click the image for the interactive version: click a box to see what it is and where it is covered, step through a path (a load, a store, a branch mispredict), and follow the blue labels to the posts.
1.1 Loads: Address Translation, Cache Lookup, Line Fill
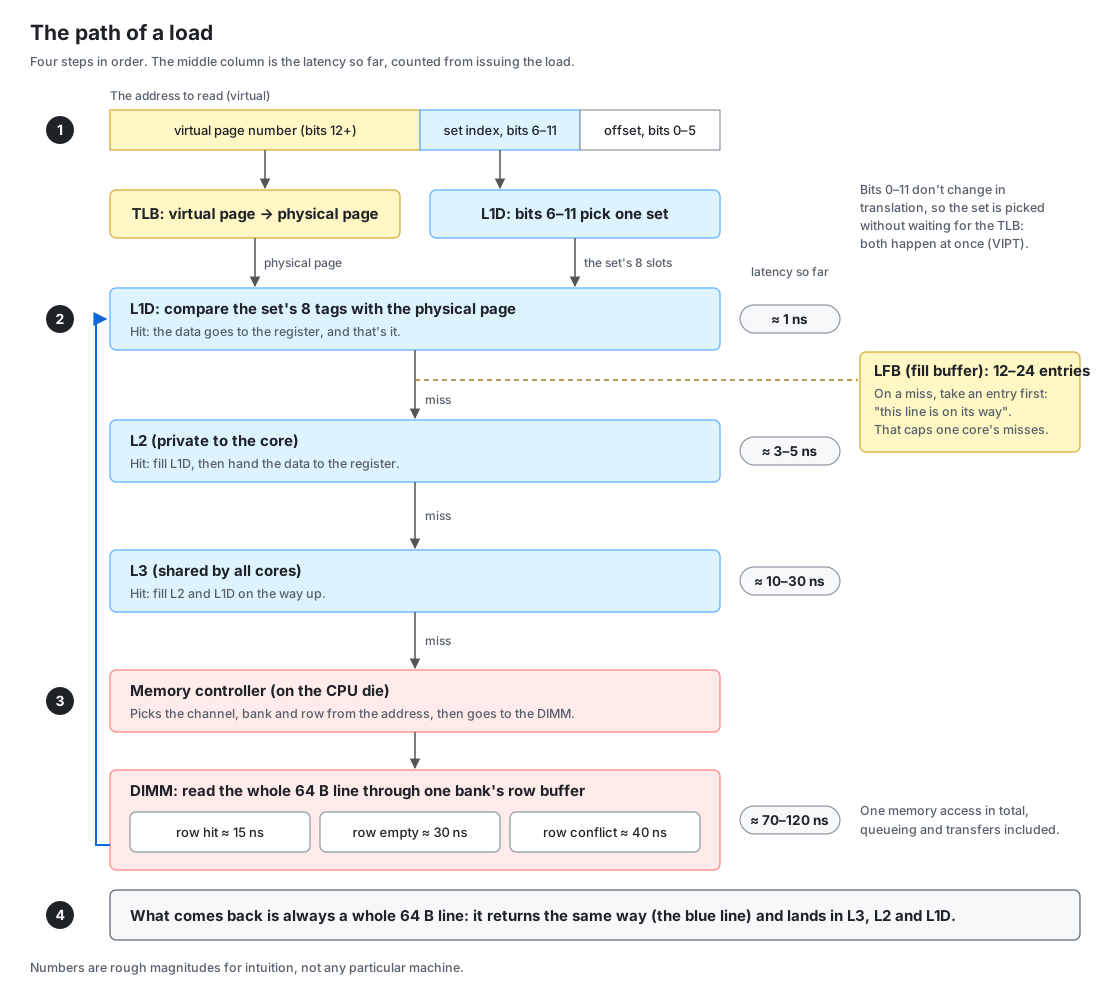
The latencies are magnitudes; see 2.1.
The LFB (line fill buffer) in step 2 is L1D’s small table of misses still on their way: each L1D miss takes an entry, which is freed once the whole line has been filled in. Its size caps how many misses one core’s own loads can have outstanding (2.3). It’s the same kind of structure AMD calls the MAB (miss address buffer) and papers and textbooks call MSHRs (miss status holding registers).
1.2 Stores: Store Buffer and RFO
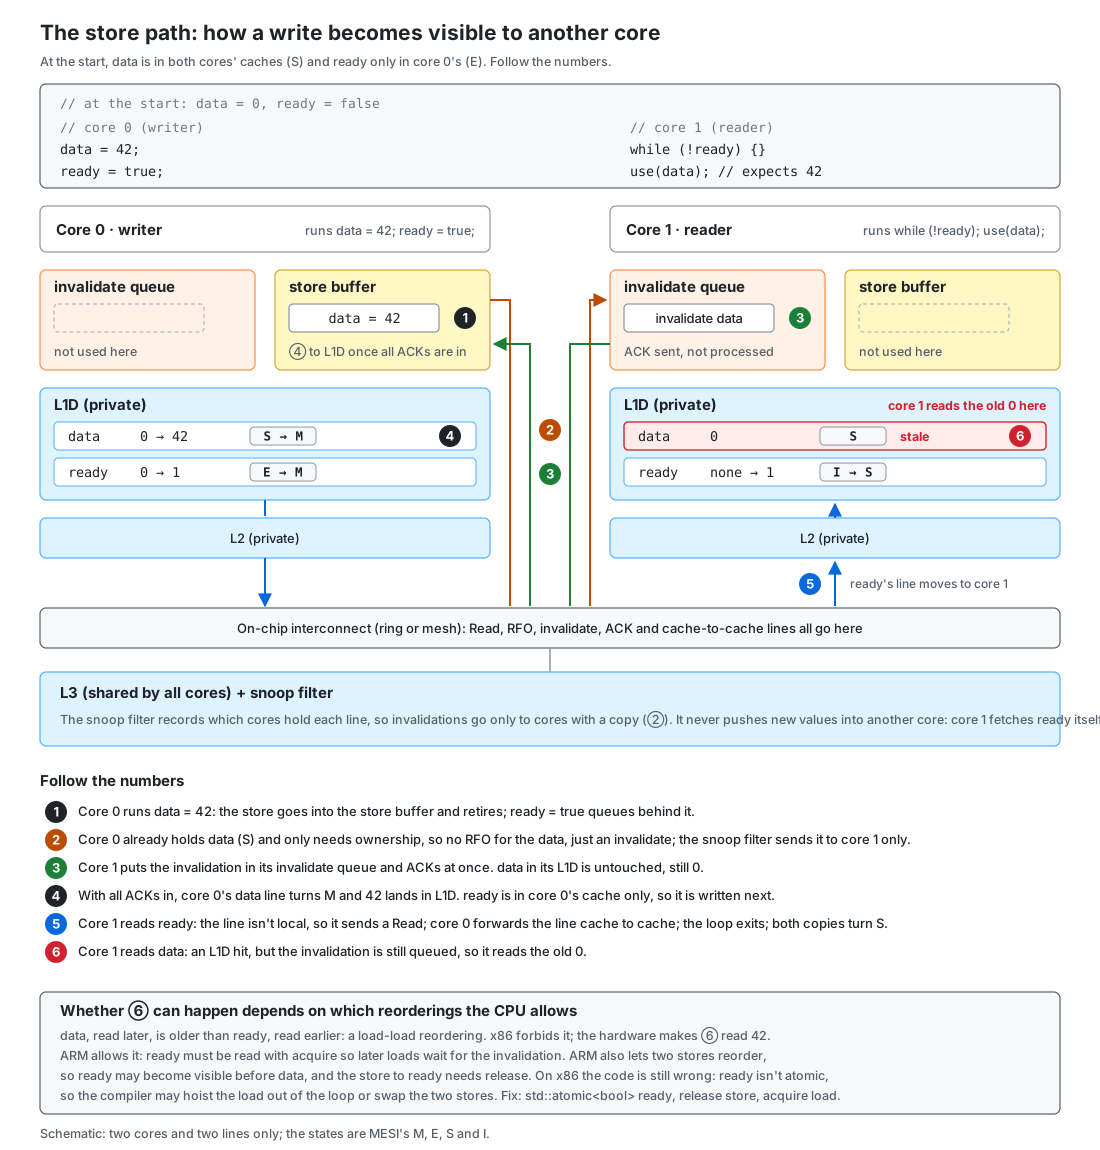
A store first goes into the store buffer, so later instructions don’t wait for it. Before it can be written into L1D, the core needs exclusive ownership of the line: every copy in another core has to be invalidated (MESI), and each of those cores queues the invalidation in its invalidate queue first. If the line isn’t in the cache, the whole line has to be read in before it can be modified, which is called an RFO (read for ownership). So a store miss also moves a whole line from memory. The modified line is written back when evicted, so an ordinary store to a line not in cache crosses the bus twice. A non-temporal store skips the read and the cache, writing each completed 64 B line straight to memory in one trip; it suits bulk data nobody reads soon.
The figure follows one store across two cores. The invalidation crosses the on-chip interconnect and goes only to cores that hold the line, which the snoop filter next to L3 keeps track of; the new value is never pushed over, and another core fetches it when it needs it. The other core ACKs as soon as the invalidation is in its invalidate queue, so it can see the later ready and still read the old data. x86 forbids this load-load reordering and ARM allows it, which is why an acquire on ARM takes a real instruction (2.1, #2).
1.3 Post Index: Which Post Covers Which Box
| Box | Post |
|---|---|
| Cores, SMT, NUMA, interrupts on a core | #1 CPU Isolation and NUMA |
| Pipeline and dependency chains, registers, store buffer, invalidate queue, cache lines and false sharing | #2 Memory Ordering and Cache Lines |
| Cache coherence | MESI |
| Locking memory, TLB shootdowns | #3 Memory Pools and Allocators |
| Several cores reading and writing one line | #4 Lock-Free Queues · #5 SPMC Broadcast Ring · #16 Spinlocks |
| Page faults | #5 SPMC Broadcast Ring |
| Alignment, layout, set associativity, inside a DIMM, refresh, channels | #6 Alignment, Layout, and Geometry |
| Branch predictor, fetch and speculative execution | #7 Branch Prediction |
| Execution units: ALU, multiplier, divider, SIMD units | #12 Strength Reduction and Arithmetic Optimization · #15 SIMD Vectorization |
| Hardware prefetch, software prefetch, cache warming | #14 Prefetching, Warming, Double Buffering |
| Performance counters (PMU) and sampling: which function and instruction the time goes to | perf |
| The roads between the boxes: latency, bandwidth, ROB, LFB | Parts 2 and 3 of this page |
2. Performance Parameters: How Big and How Fast Each Box Is
These are rough magnitudes to build intuition, not the numbers of any particular machine. Cycles and nanoseconds are converted at about 4 GHz: 1 ns ≈ 4 cycles.
2.1 Latency: How Long One Access Waits
| Kind | One… | About |
|---|---|---|
| Getting data | Register read | 0–1 cycles |
| L1D hit | ~1 ns (4–5 cycles) | |
| L2 hit | ~3–5 ns | |
| L3 hit | ~10–30 ns | |
| Line sitting in another core’s cache | ~20–100 ns; false sharing pays this too (see #2) | |
| Memory, translation hits in the TLB | ~70–90 ns | |
| Memory, translation misses the TLB too | ~85–120 ns | |
| The other socket’s memory (remote NUMA) | ~120–200 ns | |
| Running into a DRAM refresh | ~300–500 ns, the extra wait in the worst case | |
| Atomics | Atomic load (any order), relaxed or release store | ~1 ns (4–5 cycles), same as a plain load or store: a mov on x86; on ARM the ordered ones become ldar and stlr, which aren’t slow either |
| seq_cst store | ~1–5 ns (4–20 cycles): an xchg on x86, as expensive as a read-modify-write; an stlr on ARM, same as a release store | |
| Acquire or release fence | 0–6 ns: no instruction on x86, one dmb on ARM | |
Uncontended atomic read-modify-write: fetch_add, CAS, exchange (line in your own L1) | ~2–6 ns (8–25 cycles): a lock-prefixed instruction on x86, ldaddal, casal and the like on ARM | |
| seq_cst fence | ~2–6 ns (8–25 cycles): GCC emits lock or on x86; dmb ish on ARM | |
x86’s sfence, lfence, mfence | 1–6, 4–15, 30–80 cycles; for lfence, not counting the wait for earlier instructions | |
One pause in a spin-wait loop | ~140 cycles (~35 ns), the number to use on today’s trading servers; Intel chips before Skylake take only ~10, so spin budgets count time, not iterations; ARM has no equivalent and uses yield (a no-op on many cores) or isb (see #16) | |
| Uncontended mutex lock plus unlock | ~10–25 ns: two atomic read-modify-writes; when contended and it has to sleep, see the futex row in the “System” group | |
| Contended atomic read-modify-write (another core holds the line, it has to be pulled over first) | ~20–100 ns, slower the more cores compete; falsely shared counters pay this too | |
| Arithmetic | Integer add/subtract, bit operation, shift | 1 cycle |
| Integer multiply | 3 cycles | |
| Floating-point add/subtract, multiply | 3–5 cycles | |
| Floating-point divide, square root | ~3–5 ns (10–20 cycles) | |
| Integer divide, remainder | ~3–20 ns (10–90 cycles) | |
| Branches | Correctly predicted branch | 0–1 cycles |
Conditional move (x86 cmov, ARM csel) | 1 cycle, but it waits for the condition and both values | |
| Non-inlined function call (direct) | ~1–2 ns (a few cycles): call, ret plus saving registers; the real cost is the lost inlining, since the compiler can’t optimize across the call | |
| One branch mispredict (pipeline flush, see #7) | ~4–5 ns (15–20 cycles) | |
| Virtual function call | ~1–2 ns when predicted, about the same as a direct call; add a branch mispredict when it guesses wrong, and a data fetch when the vtable isn’t cached (see virtual functions) | |
| System | malloc plus free (small block) | ~10–50 ns from the thread’s own cache; when the cache is empty and it asks the OS for memory, it enters the kernel and reaches µs |
| Simplest system call | ~0.1–0.5 µs | |
| First write to a page (page fault) | ~1–2 µs | |
| Throwing and catching an exception | ~1–2 µs, more with a deeper stack | |
| Thread switch | ~1–5 µs, plus the cost of a cold cache afterwards | |
| Sleep on a taken lock, then get woken (futex: from the unlock until the waiter runs) | ~2–10 µs: two system calls plus two thread switches; longer if the waiter’s core was in a deep power-saving state (see #16) | |
| NVMe SSD 4 KiB read | 10–100 µs |
The two memory rows differ in the first step, the address translation in 1.1’s figure: when the TLB has no entry for the page, the hardware walks the page tables level by level (a page walk) to find the physical address before it can issue the real read. The page-table entries are usually in cache, so this adds only ~15–30 ns. Random reads over a large region pay it almost every time. With 2 MiB huge pages one TLB entry covers 512 times as much memory, and this part mostly disappears.
How much a TLB covers is $\text{TLB entries} \times \text{page size}$: 64–96 entries in the L1 dTLB and 1500–3000 in the STLB cover only ~6–12 MiB with 4 KiB pages, several GiB with 2 MiB pages. For the other-socket row: which node a physical page lands on is decided at first touch, by whoever writes it first, and it doesn’t follow the thread afterwards. Pinning a thread to the other node leaves its memory where it was.
What an atomic costs is what it has to wait for. x86 allows only one kind of reordering to begin with: a later load passing an earlier store that is still in the store buffer (#2). So plain loads and stores already have acquire and release semantics: atomic loads and relaxed or release stores are plain movs, and acquire or release fences only stop the compiler from reordering and emit no instruction. ARM allows far more reordering, loads with loads and stores with stores included, so the ordering has to be paid for with instructions: the ordered accesses ldar and stlr aren’t slow themselves, they just keep other accesses from passing them; the barrier dmb waits for earlier accesses to finish, which is why the acquire/release fence row isn’t 0 on ARM. seq_cst also forbids a later load passing an earlier store: on x86 the only way is to turn the store into a lock-prefixed xchg; on ARM an stlr and a later ldar never pass each other anyway, so a seq_cst store stays an stlr and the cost moves to that later ldar, which has to wait for the store to finish.
A read-modify-write holds the line in its own L1 while it reads, modifies and writes, and it first waits for the earlier stores in the store buffer to reach the cache; x86’s lock-prefixed instructions and ARM’s ldaddal and casal both work this way, so with unwritten stores queued ahead, it takes longer than the table says. x86’s standalone fences move no data either; they too pay for waiting: lfence waits until every earlier instruction has finished, so a cache miss just before it has to come back first; sfence orders only stores against stores, which plain stores already are, so it mainly goes with non-temporal stores; a hand-written mfence also has to order non-temporal stores and the like, which makes it heavier than a lock instruction, and GCC uses lock or for a seq_cst fence instead.
Under contention, the cost is pulling the line over from another core first, the same bill as “line sitting in another core’s cache”. When N cores take turns doing read-modify-writes on one line, each core waits for the other N−1 to move it once in between, so every operation gets slower the more cores compete (2.6).
The integer-division row is wide because the quotient can only be found round by round, a few bits per round: a 64-bit division needs more rounds than a 32-bit one, and recent chips produce more bits per round. A multiplier can start a new multiply every cycle and a divider can’t, so divisions on the hot path are best turned into multiplies or shifts (see #12).
A mispredict costs about as much as an L2 hit, but it can’t be hidden: on an L2 miss, out-of-order execution keeps working on later independent instructions; on a mispredict, everything fetched after the branch is thrown away and fetch starts over, so for those dozen-plus cycles the back end has no correct work to do. A conditional move (cmov, csel) replaces the branch with picking one of two values, so there is nothing to mispredict, but it has to wait for the condition and both values: when the branch is predicted well, the CPU runs ahead without waiting for the condition and the branch can be faster; when the condition is random, the conditional move pays off (see #7).
From L1 to memory, each level is 3–10× slower than the one above, about 100× in total. The microsecond rows are outside the cache hierarchy altogether, where the operating system is doing work for you: one page fault costs as much as 1,000–2,000 L1 hits.
2.2 Bandwidth: How Much Arrives per Second
| Data in | One core, sequential reads | Whole chip |
|---|---|---|
| L1D | ~150–400 GB/s | $\text{cores} \times \text{one core}$ |
| L2 | ~80–200 GB/s | $\text{cores} \times \text{one core}$ |
| L3 | ~30–150 GB/s | ~0.3–3 TB/s, growing with core count |
| Memory | ~15–60 GB/s | ~50–500 GB/s, depending on the number of channels (2.5) |
| PCIe 4.0 ×16 | — | ~32 GB/s each way |
| NVMe SSD | — | 3–7 GB/s |
Two things to notice:
- Latency spans 100×, bandwidth only 10×. From L1 to memory, one core’s bandwidth drops from 150–400 GB/s to 15–60 GB/s. The two columns aren’t two ways of writing one quantity; what sits between them is the number of requests in flight (2.3).
- One core can’t take the whole chip. What one core gets is set by its requests in flight and the latency (Little’s law, 2.3); the chip’s peak is set by the number of channels. The longer the latency and the more channels, the smaller one core’s share, anywhere from ~10% to ~80%.
- More cores, smaller shares. With k cores scanning, each gets about $\min(\text{alone},\ \text{chip peak} \times (70\%\text{–}90\%) / k)$. A 2-channel chip saturates with 2–4 cores; with 8–12 channels and 32–128 cores, each core gets a few GB/s when all scan. More channels raise only the second term.
2.3 Memory-Level Parallelism (MLP): How Many Can Be in Flight
Misses that have been issued and haven’t come back yet are outstanding requests, and how many there can be at once is the memory-level parallelism (MLP). How much bandwidth one core gets follows from Little’s law in queueing theory: the average number of requests in a system equals how many complete per second times how long each one stays.
$$ \begin{aligned} \underbrace{L}_{\text{requests in flight}} &= \underbrace{\lambda}_{\text{requests completed per second}} \times \underbrace{W}_{\text{latency}} \\ \text{one core's bandwidth} &= \lambda \times 64\ \text{B} = \frac{\text{requests in flight} \times 64\ \text{B}}{\text{latency}} \end{aligned} $$A miss takes an entry at every level on its way out and back, and whichever level fills first caps the number in flight:
| Structure | Entries, roughly | What it limits |
|---|---|---|
| ROB (reorder buffer) | 200–600 | Instructions enter in program order, execute out of order, and retire in order. It sets how far ahead out-of-order execution can look: while a miss is stuck at the head, only the independent loads inside the window can go early |
| Load queue | 70–200 | Every load holds an entry from entering the window until it retires. In load-dense code it can fill before the ROB |
| L1D LFB (1.1) | 12–24 | How many L1D misses one core’s own loads can have outstanding |
| L2 MSHRs (outstanding-request queue) | 30–60 | Where the L2 prefetcher’s extra requests wait, without using LFB entries |
| Store buffer | 50–110 | Stores park here instead of waiting for the cache |
Below that sits the memory controller, which spreads requests over channels and banks to work in parallel (2.5).
The ROB and the instruction window: a memory miss takes 300–500 cycles. Once the missing load reaches the head of the ROB it can’t retire, and everything behind it waits, while the front end keeps adding 4–8 instructions per cycle at the tail, so a 200–600-entry ROB fills in about 100 cycles (20–30 ns). After that the core just waits. So the only loads that can overlap this miss are the independent ones among the next 200–600 instructions, a stretch called the instruction window. With a 500-entry ROB:
| Code | Instructions between independent misses | In the window | Hits first |
|---|---|---|---|
Linked list p = p->next | The next address waits for this read | 1 | The dependency chain; a bigger ROB doesn’t help |
s += a[idx[i]] with a huge a and shuffled idx | ~5 | ~100 | The LFB |
| ~150 instructions of hashing before each lookup | ~150 | ~3 | The ROB |
Same core, same memory, and only the number in flight changes: bandwidth moves by 20–70× (at 80 ns and 64 B per line):
| Access pattern | In flight | One core’s bandwidth |
|---|---|---|
| Linked list: the next address waits for this read | 1 | 64 B ÷ 80 ns ≈ 0.8 GB/s |
| Independent addresses the prefetcher can’t help with (random, or a stride that crosses a page every time: prefetchers don’t cross 4 KiB pages) | The LFB’s 12–24 entries | ~10–20 GB/s |
| Sequential reads, prefetchers at full speed | ~30–70 | ~15–60 GB/s (the figure in 2.2) |
The last row has more requests in flight than the LFB has entries. The extra ones are the L2 prefetcher’s, waiting in the L2 MSHRs on your behalf.
How far ahead to software-prefetch: one full latency early, $D \approx \text{latency of one miss} / \text{time per element}$, e.g. 100 ns ÷ 5 ns = 20. Too small and you still wait; too large and the LFB runs out, or lines wait in L1 so long they get pushed out. Hardware prefetchers usually stop at 4 KiB page boundaries.
2.4 Bandwidth Demand and Arithmetic Intensity: How Fast the CPU Wants Data
Whether memory bandwidth is the bottleneck also depends on the demand side: if data arrived for free, how many bytes per second would the loop consume? That’s its bandwidth demand. It’s set by the arithmetic intensity, the number of operations per byte moved: the less work per byte, the faster the loop eats. Taking the smaller of the demand and the supply in 2.2 is the roofline model. One core at about 4 GHz:
| Loop | Per cycle | Per second | Compared with memory |
|---|---|---|---|
float sum, one accumulator, no -ffast-math | 4 B every 3–4 cycles: each add waits for the previous one | ~4–5 GB/s | Below one core’s memory bandwidth: stuck on the add chain, not on memory |
int sum, one accumulator, not vectorized | 4 B | 16 GB/s | Only memory barely keeps up with it |
| Vectorized (SIMD), several accumulators (two 32 B loads per cycle) | 64 B | ~256 GB/s | Memory-bound as soon as data leaves L1 |
| The L1 load ports’ limit (2–3 loads per cycle, 32–64 B each) | 64–128 B | 250–500 GB/s | — |
| 100+ operations per element | Under 1 B | — | Almost always compute-bound |
Two terms in the table:
- Vectorization (also SIMD, single instruction multiple data): one instruction works on a whole row of values. An AVX2 vector register is 256 bits (32 B) wide and holds 8
ints or 8floats, so one add instruction does 8 additions where a scalar loop does 1. One vector load reads 32 B and fills exactly one register, and most cores can issue 2 loads per cycle: that is the table’s “two 32 B loads per cycle”. You can leave it to the compiler (-O3, plus-mavx2or-march=nativeto allow AVX2; by default it uses only 16 B-wide SSE) or write intrinsics by hand (compiler built-in functions such as_mm256_add_epi32). - Multiple accumulators: in
s += a[i]each step waits for the previous result, and that chain is the dependency chain. With one accumulator the adds run one after another and the load ports can’t be kept fed. Splittingsinto several independent accumulators and combining them at the end lets several adds run in the execution units at the same time, which is instruction-level parallelism (ILP). How many you need is Little’s law from 2.3 again: $\text{adds in flight} = \text{adds completed per cycle} \times \text{add latency}$. Vector integer adds have a latency of about 1 cycle, so 2 × 1 = 2 accumulators are enough.floatadds take 3–4 cycles, so you need 2 × 3–4 = 6–8. Whether the compiler does it for you is in the table below.
What GCC actually does with these two:
| Sum | Vectorizes | Splits into several accumulators |
|---|---|---|
int | Yes (with -O3) | No: one vector accumulator |
float, no -ffast-math | No: addition isn’t associative, reordering changes the last few bits | No: scalar adds, one chain |
float, with -ffast-math | Yes | No: one vector accumulator |
The compiler vectorizes an int sum by itself, while a float sum needs -ffast-math. GCC splits the accumulators for neither (-funroll-loops only repeats the same dependency chain), so that part is by hand. Whether one accumulator is enough depends on where the data is and how long the add takes. An int add (latency 1 cycle) allows one 32 B load per cycle, about 128 GB/s: enough when the data is in L3 or memory (15–150 GB/s), a drag in L1/L2 (80–400 GB/s). A float add (latency 3–4 cycles) allows one 32 B load every 3–4 cycles, about 32–43 GB/s: barely enough for memory (15–60 GB/s), too slow for L1/L2/L3. Other compilers (clang, for one) behave differently: read the assembly.
“How fast is the CPU” isn’t one number: the same sum, written differently, ranges from 4 GB/s to 250 GB/s, a 60× spread. Bandwidth is the bottleneck only when the loop eats faster than memory delivers.
2.5 DRAM: Channels, Row Buffers, Refresh, Loaded Latency
| Quantity | About |
|---|---|
| One channel’s peak | $\text{transfer rate} \times 8\ \text{B}$: ~20–25 GB/s for DDR4, ~40–50 GB/s for DDR5 |
| The chip’s peak | $\text{channels} \times \text{one channel's peak}$: ~50–100 GB/s with 2 channels, ~200–500 GB/s with 8–12 |
| What you actually get | All cores reading: 70–90% of peak |
| Row buffer | ~15 ns on a hit to the open row, ~30 ns with no row open, ~40 ns on a row conflict |
| Refresh | Every ~7.8 µs (tREFI), blocking ~300–500 ns each time (tRFC). A memory access hits one with probability ≈ 300–500 ns ÷ 7.8 µs ≈ 4–6%; that’s more than 1%, so the P99 of memory accesses is basically the ones that hit a refresh |
| Loaded latency | The fuller the bandwidth, the slower each access; near the limit it can exceed 2× the idle latency |
2.6 Cache-Line Ping-Pong: A Line Bouncing Between Cores
One producer writes into a ring nonstop while readers on other cores busy-poll the same blocks (the experiment in #5). With no readers, the line stays in the producer’s own L2 and each write takes about 3 ns. With readers sitting on the producer’s next block, every block has to invalidate their copies before it can be written (MESI), and each write climbs to about 20–40 ns, more with more readers. That’s flat-out throughput: when writes are spaced out, the store buffer hides the round trip, and in a large ring readers that have fallen behind never touch the lines the producer is writing, so they cost nothing (#5 1.6). A single cross-core round trip by itself is ~20–100 ns (2.1).
3. Estimation Model: Lines to Move × Time per Line
None of the numbers in Part 2 explains slow code on its own. Strung together they make one formula, and each of the four questions (3.1) belongs to one factor:
$$ \text{total time} \;\approx\; \underbrace{\text{lines to move}}_{\substack{\text{Q1 spatial locality} \\ \text{Q2 temporal locality}}} \;\times\; \underbrace{\text{time per line}}_{\substack{\text{Q3 hit level} \\ \text{Q4 MLP}}} $$Turn the time per line upside down and you get lines per second. It has two ceilings, and the lower one wins:
$$ \text{lines per second} \;=\; \min\Bigg(\underbrace{\frac{\text{requests in flight}}{\text{latency}}}_{\substack{\text{one core hits this first} \\ \text{(Little's law)}}},\;\; \underbrace{\frac{\text{peak bandwidth}}{64\ \text{B}}}_{\substack{\text{usually takes} \\ \text{many cores}}}\Bigg) $$Finally take the smaller of that and the bandwidth demand (2.4); this last step is the roofline:
$$ \text{actual speed} \;=\; \min\big(\,\text{bandwidth demand},\;\; \text{useful bytes per line} \times \text{lines per second}\,\big) $$3.1 Locality, Hit Level and MLP: Four Questions
- Q1 Spatial locality: how many bytes of each line get used. Reading
ints one after another, one 64 B line feeds 16 of them; with a stride of 64 B or more, each line feeds just 4 B, so the same useful data takes 16 times as many lines. “Wasted bandwidth” is about this question only, and has nothing to do with whether the bus is full. A 64 B stride is already the worst case; larger strides aren’t worse on this count. - Q2 Temporal locality: does a fetched line survive until it’s needed again. It can fail for four reasons, and the first three are the classic 3C classification:
- Compulsory miss: the first touch, which nobody avoids.
- Capacity miss: more reused lines than the level holds. The fix is blocking: work on one cache-sized chunk at a time.
- Conflict miss: addresses crowding into one set, the critical stride in #6. Padding fixes this one, and only this one.
- Coherence miss: another core wrote the line and your copy was invalidated (2.6). Only multicore has this one.
- Q3 Hit level: which level supplies it. That sets the latency and the peak bandwidth; numbers in 2.1 and 2.2.
- Q4 MLP: how many can be in flight at once. If the next address waits for this read (pointer chasing: linked lists, trees, hash chains), there is one, and every line pays a full latency. If addresses are computed, out-of-order execution issues later loads early from within the ROB’s window, up to a full LFB. If the walk is sequential, the prefetcher keeps another batch outstanding for you (2.3). That’s what “the pipeline hides latency” means: latency doesn’t get shorter; many waits overlap.
3.2 Examples
These are estimates from one set of typical numbers: memory latency ~90 ns, one core reading memory at ~35 GB/s, the whole chip at ~50 GB/s.
- Sequential sum over a big array, vectorized. Q1: every line is fully used. Q4: prefetchers at full speed, about 35 GB/s for one core, while the bandwidth demand is about 256 GB/s. The smaller one wins: about 35 GB/s, bound by memory bandwidth. With 4 cores scanning, they hit the chip’s ~50 GB/s together and each gets only about 12 GB/s.
- The same sum with
floatand one accumulator. The bandwidth demand is only about 4 GB/s, less than memory delivers. Data in L1 or in memory runs at nearly the same speed; going faster means breaking the dependency chain (several accumulators, #2), and faster memory does nothing. - Walking a linked list scattered over the heap. Q4 is 1: each node pays a full memory latency, about 90 ns, so 1 million nodes take about 90 ms. The road is wide, and 0.7 GB/s of it is used. The only fixes are keeping nodes next to each other (an array, a pool) or keeping them in cache.
- One table lookup on the hot path that goes to memory. About 90 ns: 360 cycles at 4 GHz, the time of 90 L1 hits. A hot path touches only a few lines per market-data message, so bytes are tiny; what hurts is a dependent miss like this one (Q3, Q4), not bandwidth.
- Another core on the same chip scanning backtest data. The strategy is pinned to an isolated core and its hot path touches a few lines, using almost no bandwidth, yet it slows down, for two reasons that multiply. More misses: the backtest flushes L3, so lines the hot path used to hit in L3 (~10–30 ns) now go to memory (~90 ns). Slower misses: the memory controller is full of the backtest’s requests, the hot path’s few misses queue behind them, and loaded latency can reach 2× idle or more, about 200 ns. Lines the core keeps using in its own L1/L2 survive (except on chips with an inclusive L3). Pinning isolates compute, not the shared road through L3 and memory. The fixes: move the backtest elsewhere, or cap its L3 with CAT and its memory bandwidth with MBA.
3.3 Common Pitfalls
- A full LFB means maximum overlap, not “falling back to serial”. With N entries in flight, miss N+1 waits for the oldest one to return and free its slot, so the steady state keeps N in flight and each line costs $\text{latency} / N$. Only dependency chains are truly serial. So bandwidth and latency aren’t either-or: by Little’s law (2.3), with the number in flight fixed, one core’s bandwidth is inversely proportional to latency, and when latency grows (DRAM row conflicts, TLB misses), the same N moves fewer lines per second.
- “5 ns per line” is throughput, not latency. 80 ns ÷ 16 = 5 ns is an average; every line still takes the full 80 ns.
- “Bandwidth-bound” has two ceilings, the two terms of the min in Part 3. One core hits the first (Little’s law); the chip’s peak takes several cores pushing together. Before saying “the bus is saturated”, ask how many cores.
- Padding fixes conflicts, not capacity. One extra cache line per row sends addresses a critical stride apart to different sets; but if more lines need to be reused than the level holds (one column of 2048 rows is 2048 lines, 128 KiB, against 32 KiB of L1D), padding can’t make them fit, and blocking can.
For any claim about memory access, first ask which of the four questions it answers; when one paragraph mixes several, take them apart.