
A tick comes in, and the 64 options written on that stock have to be repriced: each option’s price moves a little with the underlying, then an alpha is computed, and the options whose alpha clears a threshold are collected. That is only 25 floating-point operations per option, yet the median for this code is 510 ns and the p90 is over 1 µs. Most of that time the CPU is waiting for data.
At CppCon 2026, Sanchit Gupta of Graviton Research Capital, a high-frequency trading firm, gave a talk built around this code (video, slides, code; I found it through an introduction on Zhihu, in Chinese). In four steps he brought the median down to 329 ns and the p90 to 550 ns. Not one floating-point operation went away; what changed is when the data arrives, which level it lands in, and which core holds it at that moment.
Most of the mechanisms in these steps have their own posts here: MLP (memory-level parallelism) and the LFB (line fill buffer), software prefetching, MESI. Put into one piece of code, you can see what each one is worth, and also that they compete for the same thing: each core has only 16 LFBs, and batching, prefetching and clflushopt all take them. All numbers below were measured on the talk’s machine: an i9-14900KS with the cores at 5.9 GHz, only 4 P-cores online, SMT off, the program on an isolated core; cycle counts are TSC (time stamp counter) cycles at 3.19 GHz.
1. One Event’s Bill: 140 Cache Lines, Mostly From L3
1.1 The Data Layout: Option Addresses Live in the Stock Record
A writer thread on another core appends a 192 B event to an 8 MiB ring buffer every 5 µs: exactly 3 cache lines. The consumer thread is pinned to an isolated core and reads each event once, never touching it again.
The event names a stock. The stock table has 8,192 records of 576 B, that is, 9 lines each: the last price, plus 64 (option id, delta) pairs. The option table has 524,288 records of 128 B, two lines each: one holds the prices, the other the state the alpha needs, and both are read.
There is one dependent hop here: an option’s address is read out of the stock record, so no option can be requested before the stock record arrives. Once it has, the 64 options are independent of each other and can be computed in any order. The later steps all revolve around these two facts.
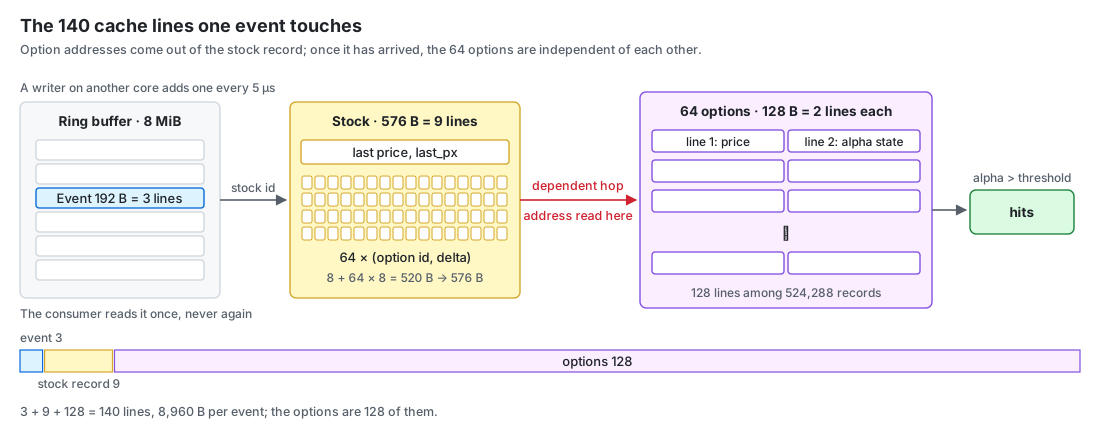
In code:
#include <cstdint>

constexpr int    K = 64;                          // options per stock
constexpr double kThreshold = 0.5;                // record an option once its alpha exceeds this

struct Holding { uint32_t option; float delta; };   // option id, delta against this stock

struct alignas(64) Event {                        // 192 B = 3 lines
    uint64_t seq;
    uint32_t stock;
    double   px;
    char     book[168];
};
struct alignas(64) Stock {                        // 8 + 512 B, padded to 576 B = 9 lines
    double  last_px;
    Holding holds[K];
};
struct alignas(64) Option {                       // 128 B = 2 lines
    double curr_px, actual_px, aux[6];            // line 1: prices
    double ema, alpha, state[6];                  // line 2: the state alpha needs
};

// a chain of dependent floating-point operations (25 in the talk) that reads both lines
inline double alpha_of(double px, double ref, double aux, double& ema) {
    ema = 0.9 * ema + 0.1 * px;
    double x = (px - ref) / (aux + 1.0), a = x;
    for (int i = 0; i < 10; ++i) a = a * x + 0.01 * i;
    return a + 0.01 * (px - ema);
}
1.2 The Baseline: Fetch and Compute One Option at a Time
Processing one event: look up the stock record, work out how far the price moved (move), then update the 64 options one by one. The loop is pulled out into price_span because in Section 5, when the work is split across two cores, each side runs one span of it.
// reprice a span of holdings one by one: ids of options over the threshold go to hits; returns the count
int price_span(const Holding* h, int count, double move, Option* options, uint32_t* hits) {
    int n = 0;
    for (int j = 0; j < count; ++j) {
        Option& o = options[h[j].option];            // the address comes out of the stock record
        o.curr_px += move * h[j].delta;
        o.alpha = alpha_of(o.curr_px, o.actual_px, o.aux[0] + o.aux[4], o.ema);
        if (o.alpha > kThreshold) hits[n++] = h[j].option;
    }
    return n;
}

int on_tick(Event& ev, Stock* stocks, Option* options, uint32_t* hits) {
    Stock& st = stocks[ev.stock];                    // 9 lines
    const double move = ev.px - st.last_px;
    st.last_px = ev.px;
    return price_span(st.holds, K, move, options, hits);
}
Around it sits another loop that spins on the ring’s sequence number (an acquire load) and calls on_tick when the next event shows up. The talk measures the time to process each event: a median of 510 ns, a p90 of 1,012 ns, 8,142 instructions per event.
1.3 Where the Time Goes: 130 Misses, Only Partly Overlapped
The lines one event touches:
$$ \underbrace{3}_{\text{event}} + \underbrace{9}_{\text{stock record}} + \underbrace{64 \times 2}_{\text{options}} = 140\ \text{lines} $$128 of the 140 are option lines, scattered across half a million records. Over 200,000 events the run touches 42.7 MiB of the tables; add the 8 MiB ring streaming through and that is 50.7 MiB against a 36 MiB L3. The tables cannot all stay cached, and the ring keeps pushing them out as it streams past.
Where the baseline’s loads land, per event on average:
| Level | Per event | One access on this machine |
|---|---|---|
| L1 | 222 | 0.85 ns |
| L2 | 19 | 2.7 ns |
| L3 | 104 | 12.3 ns |
| Memory | 7 | 88 ns |
Most of the 130 misses past L1 hit in L3. If they were waited for one at a time:
$$ 104 \times 12.3\ \text{ns} + 7 \times 88\ \text{ns} \approx 1.9\ \mu\text{s} $$far more than the measured 510 ns, so out-of-order execution already overlaps some of the misses. But each core can have 16 misses in flight, and the 64 options don’t depend on each other, so in principle far more could overlap.
2. Batching: A Batch’s Misses in Flight Together
2.1 Why Only Some Overlap: The Computation Fills the Out-of-Order Window
Out-of-order execution can only issue loads early from the stretch of instructions it can see: instructions that have been fetched but not yet retired sit in the ROB (reorder buffer), and a load has to be in the ROB before it can go out (Memory Latency and Bandwidth 1.3.2). In the baseline loop, the loads of two options are separated by a whole option’s computation. That chain of dependent floating-point operations can’t start until the data arrives, and while it waits it holds ROB entries; a few options’ worth fills the ROB, and the loads of the options after that haven’t even been fetched, so they can’t go out.
So how many misses are in flight at once is set by the order the code is written in. The 64 updates are independent, so the order can change.
2.2 Two Passes: Request a Batch’s Lines First, Then Compute
#include <algorithm>

// batches of D: pass one only gathers, pass two computes
template <int D>
int price_span_batched(const Holding* h, int count, double move, Option* options, uint32_t* hits) {
    int n = 0;
    for (int b = 0; b < count; b += D) {
        const int m = std::min(D, count - b);
        Option* o[D];
        double px[D], ref[D], arg[D], ema[D];
        for (int k = 0; k < m; ++k) {                 // pass one: touch both lines, read into small arrays
            o[k]   = &options[h[b + k].option];
            px[k]  = o[k]->curr_px + move * h[b + k].delta;
            ref[k] = o[k]->actual_px;
            arg[k] = o[k]->aux[0] + o[k]->aux[4];
            ema[k] = o[k]->ema;
        }
        for (int k = 0; k < m; ++k) {                 // pass two: compute alpha, write back
            o[k]->curr_px = px[k];
            o[k]->alpha = alpha_of(px[k], ref[k], arg[k], ema[k]);
            o[k]->ema = ema[k];
            if (o[k]->alpha > kThreshold) hits[n++] = h[b + k].option;
        }
    }
    return n;
}
Pass one only gathers: it computes the addresses and reads the fields it needs from both lines into a few small arrays. Consecutive options’ loads are now only a few instructions apart, so a batch of D options sends its 2D lines out almost at once. Pass two then computes the alphas and writes back.
D = 4 against the baseline (per event):
| Baseline | D = 4 | |
|---|---|---|
| Median | 510 ns | 469 ns (−8%) |
| p90 | 1,012 ns | 776 ns (−23%) |
| L3 hits | 103.7 | 104.0 |
| Instructions | 8,142 | 9,191 (+13%) |
| Instructions per cycle (IPC) | 1.98 | 2.47 (+25%) |
Not one L3 hit went away: batching removes no misses, it only stops waiting for them one at a time. The extra 1,049 instructions are the small arrays and the second loop, yet the same work fits into less time. The p90 drops much more than the median: the slow events are mostly the ones with more misses, so overlapping saves them more.
2.3 How Big a Batch: Budget the LFBs in Lines
From the moment a miss goes out until its line comes back, it holds one LFB. The talk measured this machine with lemire’s testingmlp: 29.7% of cycles have at least 16 misses in flight, and not a single cycle has 17, so each core has 16.
Each option is 2 lines, so a batch of D is 2D misses. Sweeping D from 1 to 64:
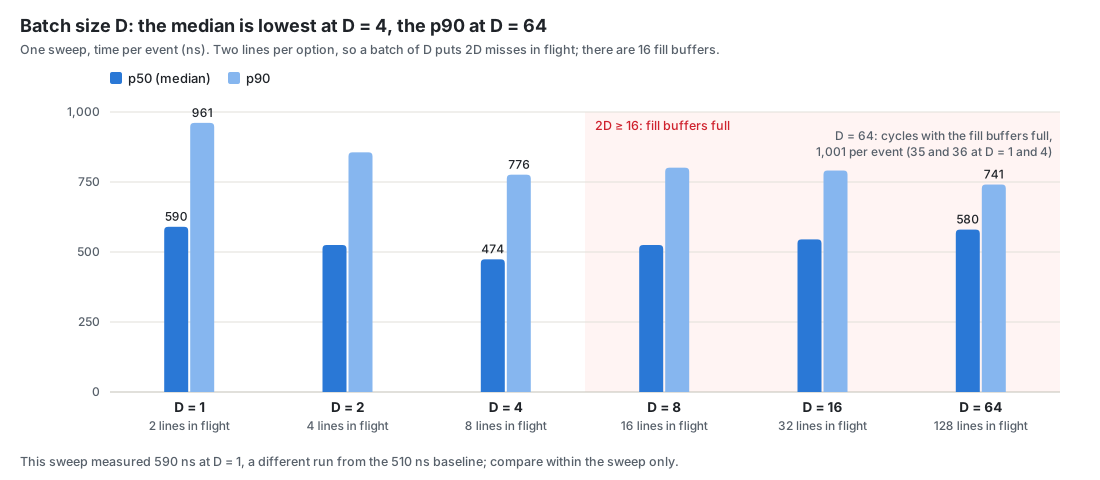
D = 4 (8 lines) gives the lowest median. D = 8 is already 16 lines, all the LFBs, while the stock record, the event and the hardware prefetchers need LFBs too, and the median climbs back to 525 ns. D = 64 requests all 128 lines of the event before computing anything; the cycles with the LFBs full and new requests turned away come to 1,001 per event (35 and 36 at D = 1 and 4), and the median falls back to 580 ns. Yet its p90 of 741 ns is the best in the sweep: the median and the tail don’t peak at the same D, and the talk picked D = 4 for the median.
After batching, a batch’s 2D lines travel together, but while pass two computes, no new requests go out: computing and waiting still take turns, and every batch starts by waiting for its own lines. Which options the next batch needs is already written in the stock record, so they could be requested before this batch is computed.
3. Software Prefetch: The Next Batch in Flight While This One Computes
3.1 A Prefetch Is Not a Load: No ROB Entry Held, but an LFB Taken
Pass one is already requesting data, so why not just run the next batch’s pass one early? Because an ordinary load has a destination register: it can’t retire until its data returns, and everything behind it piles up in the ROB, which is exactly the problem from 2.1. A software prefetch (_mm_prefetch) has no destination register; no instruction waits on it, it retires as soon as it issues, and it doesn’t hold the ROB.
But like an ordinary miss it takes an LFB until the line arrives, one of the same 16. The second argument is a hint: _MM_HINT_T0 brings the line into every level including L1, T1 and T2 only into the outer levels, and NTA says the data is used once and should take as little cache as possible (the instructions and the GCC spelling are in #14 1.2). On ARM the counterpart is the prfm instruction; GCC’s __builtin_prefetch compiles on both.
3.2 When to Ask: After Pass One, Before Pass Two
The next batch’s option ids sit in the stock record, which is in L1 by now, so the addresses are at hand. Insert these lines between the two passes (#include <immintrin.h>):
        for (int k = b + D; k < std::min(b + 2 * D, count); ++k) {   // ask for the next batch's two lines now
            const char* p = reinterpret_cast<const char*>(&options[h[k].option]);
            _mm_prefetch(p,      _MM_HINT_T0);
            _mm_prefetch(p + 64, _MM_HINT_T0);
        }
Both lines of each option, because pass one reads both. The first batch needs no priming: its own pass one already fetches in parallel, and the prefetch starts paying from the second batch on. The current batch’s computation is long enough for the next batch’s lines to arrive.
At D = 4, the median goes from 469 to 414 ns (−12%) and the p90 from 776 to 710 ns.
The prefetch distance is one batch, D options. In a separate sweep, D = 4 has the best median (394 ns) and D = 16 the best p90 (645 ns). D = 2 is too close: one batch’s computation can’t cover a miss, and 172 loads per event land on a prefetch still in flight (17 at D = 4). At D = 64 one batch is the whole event, so there is no next batch to ask for.
3.3 Real Loads or NTA Instead: Both Slower
On the same D = 16 batched walk, at the same distance, changing only how the next batch is requested (per event):
| Variant | Median | p90 | Cycles waiting on an L1 miss |
|---|---|---|---|
| No prefetch (batching only) | 520 ns | 776 ns | 1,074 |
_MM_HINT_T0 | 505 ns | 655 ns | 292 |
| Real loads instead | 550 ns | 831 ns | — |
_MM_HINT_NTA | 856 ns | 1,012 ns | 1,995 |
Real loads also request the lines early, yet come out slower than no prefetch at all: every load has to wait for its data before it can retire, clogging the ROB again. NTA is 65% slower: it tells the hardware these lines can be thrown away after use, but the next event needs these options again. Nine ticks in ten land on the same 1,024 stocks, whose options total
$$ 1024 \times 64 \times 128\ \text{B} = 8\ \text{MiB} $$too big for the 2 MiB L2, small enough for the 36 MiB L3. T0 keeps them in L3; NTA throws away exactly the lines the next event will want.
Prefetching decides which line comes in next. For a new line to come in, an old one has to leave; the replacement policy picks which, and the replacement policy doesn’t know which lines are already useless.
4. Handing Back Dead Data: clflushopt
4.1 Lines Read Once and Dead: Still Holding Space in Every Level
Each event’s 3 lines (a header and two lines of book) are useless once read; nobody touches them again until the ring comes back around 8 MiB later. But like any line they hold a way in L1, L2 and L3, and they got each one by evicting another line, possibly an option the next event needs. The replacement policy is usually pseudo-LRU (roughly, the least recently used line goes first), and these 3 lines were just used, so they are the least likely to go.
The hardware doesn’t know they are dead. The program does.
4.2 clflush and clflushopt: One Serializes, One Runs in Parallel
clflush invalidates a line at every level, writing it back to memory first if it is dirty. It is strictly ordered with the loads and stores around it, so a run of them goes one at a time. clflushopt invalidates just as thoroughly but is weakly ordered: several can be in flight at once, and they also go through the LFBs. On ARM the counterpart is dc civac (clean and invalidate by address).
Hand the three event lines back once the event is done:
int on_tick(Event& ev, Stock* stocks, Option* options, uint32_t* hits) {
    Stock& st = stocks[ev.stock];
    const double move = ev.px - st.last_px;
    st.last_px = ev.px;
    const int n = price_span_batched<4>(st.holds, K, move, options, hits);
    char* e = reinterpret_cast<char*>(&ev);          // nobody will read this event again
    _mm_clflushopt(e);
    _mm_clflushopt(e + 64);
    _mm_clflushopt(e + 128);
    return n;
}
GCC needs -mclflushopt (and -mclwb for Section 5’s clwb), or a -march that has them.
Result: the median goes from 414 to 409 ns (−1.2%), the p90 from 710 to 705 ns. Six more instructions per event (the three clflushopts and their addresses), 2.2 more L1 hits, and the cycles waiting on an L1 miss fall from 634 to 495 (−22%). The median barely moves, but a fifth of the time spent waiting on misses is gone.
4.3 It Pays Only When the Cache Is Full
The talk also ran a small separate experiment: each event reads 4 streamed lines used only once, then does one lookup in a hot table every event needs; the variants differ by a single statement (keep the lines, clflushopt, clflush), and the hot table comes in two sizes, big enough to be squeezed or small enough to feel no pressure.
| Keep | clflushopt | |
|---|---|---|
| Hot table under pressure | 106.4 ns | 92.6 ns (−13%) |
| No pressure | 83.2 ns | 86.4 ns (+4%) |
Under pressure, L3 misses fall from 4.13 to 3.69 per event. With no pressure there is nothing worth protecting, and the flush is pure overhead. The time the LFBs are busy rises from 0.8% to 4.0%: these clflushopts go through the LFBs, in parallel. With clflush instead, it costs 807 cycles with or without pressure, because it works one line at a time.
That is about as far as one core goes: 510 → 409 ns. What remains is mostly the computation of the 64 options and the misses still waited for. The 64 options are independent, so the obvious next move is to split them across two cores. But as soon as two cores exchange data, a new kind of miss appears: the line you want is in the other core’s hands.
5. Two Cores: Reading Another Core’s Line Costs About 30 ns
5.1 How to Split: Main Keeps 40, Aux Takes 24
What can be split is the 64 option updates. What can’t is the part in front: polling the ring, looking up the stock, working out move, one dependent chain with nothing to prefetch. So the main core keeps that part and the larger share (40 options), and the last 24 go to an auxiliary core. The handoff carries the option ids, deltas and move together, so the aux never reads the stock record, which is exactly the dependent hop the split is meant to avoid. The aux can only start after main hands over, so giving it less lets it finish before main finishes its own share.
#include <atomic>

constexpr int kAux = 24;                              // options handed to the aux core; main keeps 40

struct alignas(64) Req {                              // main → aux
    std::atomic<uint64_t> seq{0};
    double  move;
    Holding give[kAux];
};
struct alignas(64) Res {                              // aux → main
    std::atomic<uint64_t> seq{0};
    int      n;
    uint32_t hit[kAux];
};

// main: look up the stock, work out move, hand over the last 24, price the first 40, collect the aux's results
int main_tick(Event& ev, Stock* stocks, Option* options, uint32_t* hits,
              Req& req, const Res& res, uint64_t seq) {
    Stock& st = stocks[ev.stock];
    const double move = ev.px - st.last_px;
    st.last_px = ev.px;
    for (int j = 0; j < kAux; ++j) req.give[j] = st.holds[K - kAux + j];
    req.move = move;
    req.seq.store(seq, std::memory_order_release);
    int n = price_span_batched<4>(st.holds, K - kAux, req.move, options, hits);
    while (res.seq.load(std::memory_order_acquire) != seq) {}
    for (int i = 0; i < res.n; ++i) hits[n++] = res.hit[i];
    return n;
}

// aux: wait for this round's request, price the 24 it was given, write the results to res
void aux_tick(const Req& req, Res& res, Option* options, uint64_t seq) {
    while (req.seq.load(std::memory_order_acquire) != seq) {}
    uint32_t hit[kAux];
    const int n = price_span_batched<4>(req.give, kAux, req.move, options, hit);
    for (int i = 0; i < n; ++i) res.hit[i] = hit[i];
    res.n = n;
    res.seq.store(seq, std::memory_order_release);
}
The two cores hand over with a release store and an acquire load (#2): main fills in req and then publishes the sequence number, and the aux reads it after seeing the number; the results go the same way in reverse.
Result: the median goes from 409 to 364 ns (−11%), the p90 from 705 to 575 ns (−18%). Main’s own span takes 365 ns and the aux’s 298 ns, so main still finishes last and sets the event’s time.
The handoff costs time of its own: req and res are each written by one core and read by the other, so every line has to travel from one core to the other. The figure marks the two places where main waits on the other core:
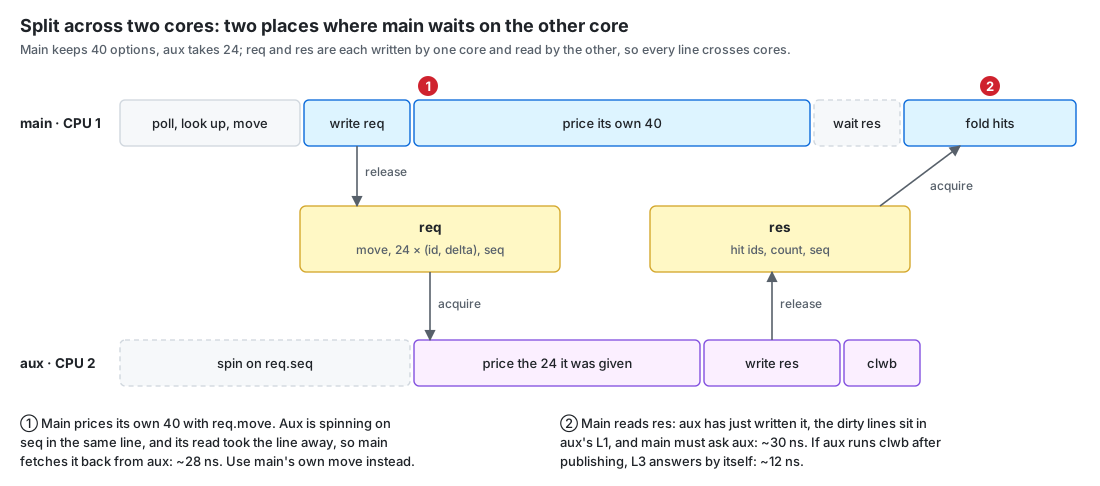
The first is one of main’s own loads, which looks completely free.
5.2 Reading Back What You Just Wrote: One Read From the Other Side and Your Copy Is Gone
After the handoff, main prices its own 40 options with req.move, the value it has just written into the handoff memory. That looks like an L1 hit: you just wrote it, how could it not be in L1?
But the aux is spinning on req.seq, which sits in the same line as move. After main’s writes, the line is Modified in main’s cache; when the aux reads it, the line is largely taken away, leaving main no copy. Main’s next read of req.move has to fetch it back from the aux.
The talk measured exactly this for one line between two cores: core 1 leaves the line clean or dirty, core 2 reads it once or leaves it alone, then core 1 touches it again and times that touch, over 4,096 rounds.
| Case | Core 1’s next touch |
|---|---|
| Core 2 never touched it, core 1 reads | 0.8 ns |
| Clean line, core 2 read it, core 1 reads | 1.0 ns: E becomes S, core 1 keeps its copy |
| Dirty line, core 2 read it, core 1 reads | 28 ns, 34 times the case above |
| Core 2 read it, core 1 writes | 54 ns, against 2.8 ns when nobody read it |
There are zero L3 misses in the whole experiment: this time is all coherence, not capacity. A write costs even more than a read: core 2 holds a copy, so core 1 has to get it invalidated and wait for the reply before writing (MESI Cache Coherence, Section 5).
The fix is one load, one instruction less: main uses its own move.
-    int n = price_span_batched<4>(st.holds, K - kAux, req.move, options, hits);
+    int n = price_span_batched<4>(st.holds, K - kAux, move, options, hits);
The median goes from 364 to 344 ns (−5.5%), the p90 from 575 to 555 ns, and cross-core forwards per event from 0.96 to 0.82. False sharing in #2 is the same thing: if a line holds a variable another core is reading or writing, every access you make to that line may have to cross cores. Here that variable is seq, and move was in main’s hands all along.
5.3 When L3 Can Answer by Itself: If One Core Holds the Line Alone, L3 Has to Ask It
The other direction is main reading the results the aux wrote into res. How long it takes to read a line another core has touched depends on where that line is and what state it is in. The talk’s second experiment: core 2 dirties the line or just reads it, then sweeps its own array to push the line down to L1, L2, L3 or memory; then core 1 reads it once and times it.
| Where the line is, what state | Core 1 reads it once |
|---|---|
| Clean, in core 2’s L1 | 29 ns |
| Clean, anywhere from core 2’s L1 to L3 | 25–29 ns |
| Clean, held by two other cores (shared) | 13 ns, L3 answers directly |
| Clean, pushed out of L3 too | 99 ns, from memory |
| Dirty, still in core 2’s L1 or L2 | 28–30 ns, same as clean |
| Dirty, pushed out of core 2’s L2 | 95 ns, from memory |
| The apparatus itself (fences plus one L1 hit) | 0.8 ns |
Two things show up. First, as long as a line might still be in one other core’s hands, the L3 can’t answer by itself, even when the line is clean: that core holds it exclusively (E) and may turn it into M without telling anyone, so the L3 doesn’t know whether it has changed and has to ask first. When two cores hold it (S) it’s different: whoever wants to write must notify the others first, so the L3’s copy is guaranteed current, and it answers in 13 ns.
Second, pushed out of core 2’s L2 the same way, the clean line stayed in L3 (29 ns, an L3 hit), while the dirty line skipped L3 and was written back to memory (95 ns, 0.96 L3 misses per read, and no core holds it). Intel’s client L3 is neither inclusive nor exclusive of L2: whether L3 keeps a line evicted from L2 is an undocumented heuristic, and on this machine clean lines stayed and dirty ones didn’t.
The result line res is the expensive kind: the aux has just written it, it is dirty and sits in the aux’s L1, and main has to ask the aux to read it. If the aux wrote it back right after writing it, leaving a clean copy in L3, main wouldn’t have to ask.
5.4 clwb: Write It Back Right Away, and L3 Can Answer
clwb and clflushopt come from the same mold: both are weakly ordered, several can be in flight through the LFBs, and you add a fence when you need to wait for them to finish. They differ in what they leave behind: clflushopt drops the line, clwb writes the dirty data back and keeps the line (Intel’s manual treats keeping it as a hint to the hardware; on this machine it was kept). That’s why the read-once event lines suit being handed back, and a line another core is about to read suits being written back. On ARM the closest counterpart is dc cvac (clean by address, without invalidating).
Measured on a single line, written or read by core 2, then read by core 1:
| What core 2 did to the line | As is | Core 2 runs clwb first |
|---|---|---|
| Wrote it (dirty) | 30 ns | 12 ns (−60%), L3 answers directly |
| Only read it (clean) | 28 ns | 26 ns: nothing to write back, core 2 still gets asked |
Once a dirty line is written back, reading it is as fast as reading a line two cores share; a clean line has nothing to write back, and clwb changes nothing.
In the handoff: after publishing its results, the aux runs clwb on every line of res.
    res.seq.store(seq, std::memory_order_release);
    for (std::size_t i = 0; i < sizeof(Res); i += 64)    // after publishing, write back every line of the results (the lines stay)
        _mm_clwb(reinterpret_cast<char*>(&res) + i);
    _mm_mfence();                                         // wait for those write-backs to finish
Main’s cross-core forwards per event fall from 0.87 to 0.34, and plain L3 hits rise from 2.53 to 3.07: the results wait for main in L3 instead of in the aux’s L1. The part where main waits for the aux’s results drops from 111 to 97 ns; the aux does exactly the same work, and only main waits less. The median goes from 344 to 329 ns, the p90 from 555 to 550 ns.
The talk only pushed the aux-to-main direction. The req lines main hands over are fetched from main in the same way when the aux reads them, and main could clwb them right after writing too; but main is on the critical path, so those extra instructions count toward the event’s time, and whether it pays would have to be measured.